
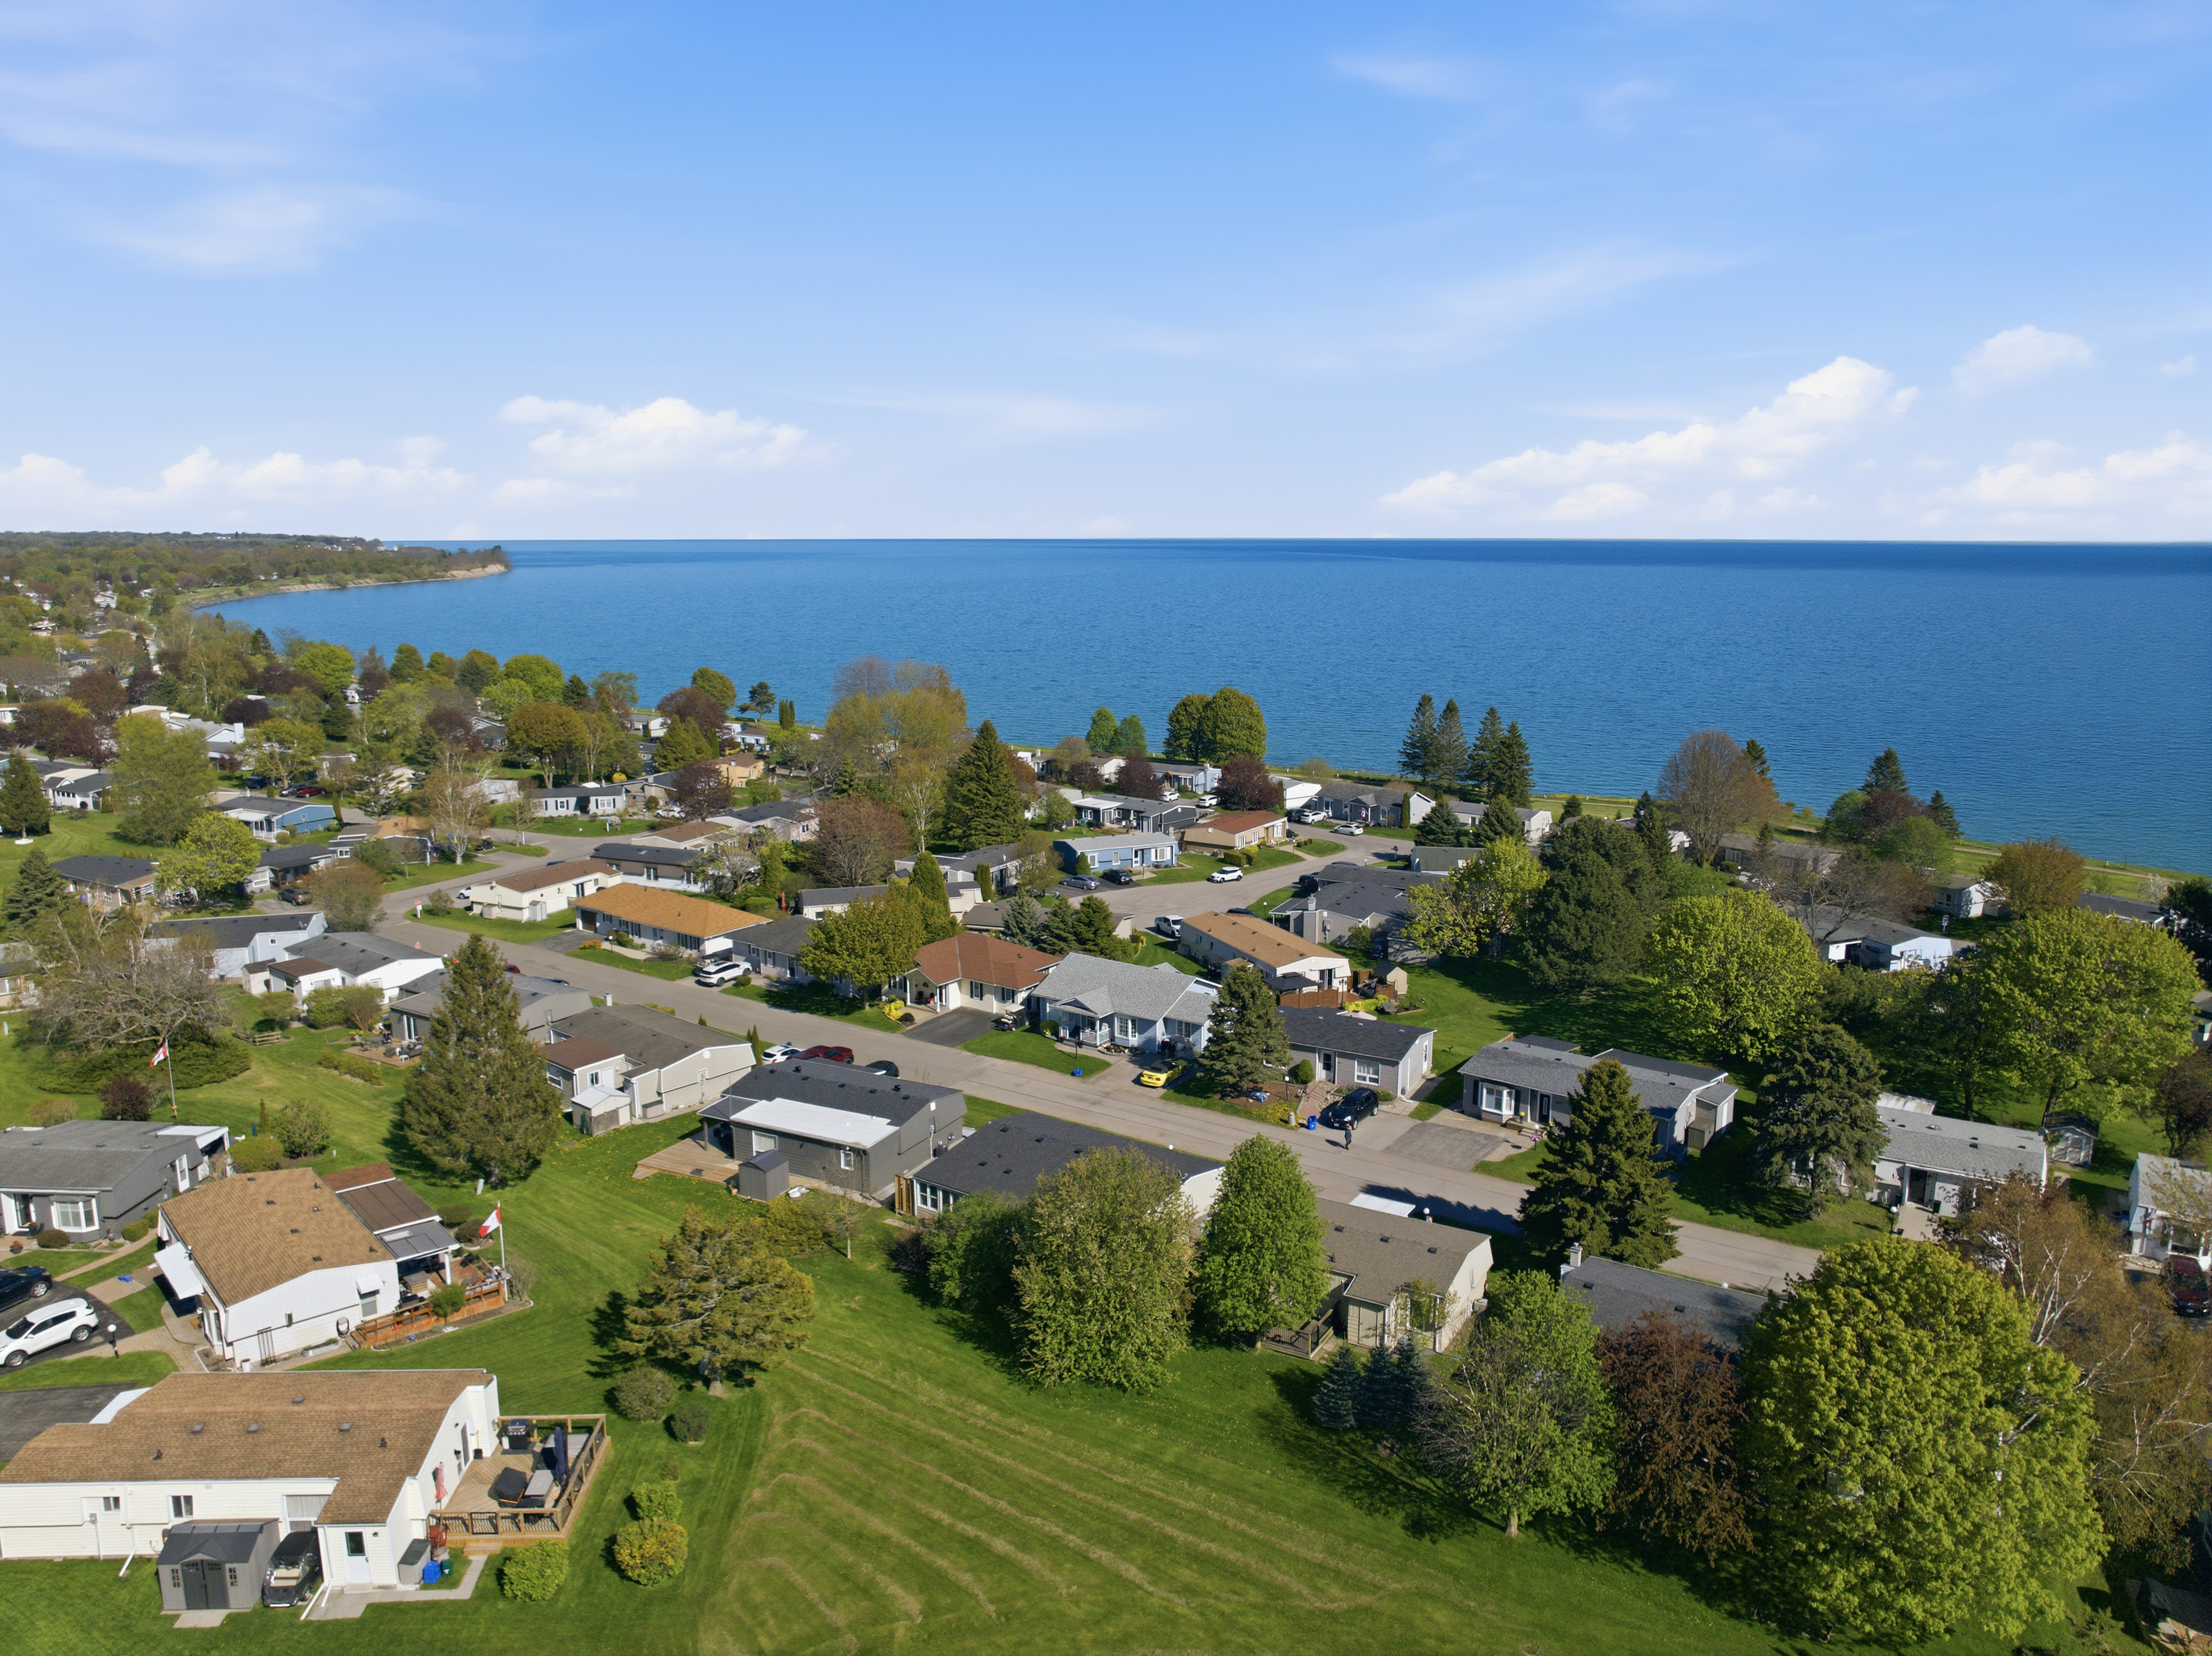
May continued the trend of strengthening market conditions across the Greater Toronto Area as sales increased and inventory tightened compared to last year. While buyers still benefited from improved affordability and negotiating power, declining inventory levels suggest that competition is beginning to increase in many neighbourhoods as we move deeper into the spring market.
GTA Market Insights
GTA REALTORS® reported 6,583 home sales in May 2026, up 6.3% compared to May 2025. At the same time, new listings declined to 17,698 (↓ 18.9% year-over-year), continuing the tightening trend that has emerged throughout the spring.
The average selling price came in at $1,069,700, down 4.6% annually, while the MLS® HPI Composite benchmark declined 6.7% year-over-year. On a seasonally adjusted basis, home sales increased 10% compared to April while new listings declined 2.1%, creating further tightening in market conditions.
Lower borrowing costs and improved affordability continued drawing buyers back into the market, while declining inventory levels suggest that pricing may begin to stabilize as demand catches up with available supply.
Durham Region Market Highlights
Durham Region remained one of the most active areas in the GTA during May, with sales increasing for the fourth consecutive month and average prices continuing to climb. While inventory remained elevated compared to the winter months, stronger buyer demand helped absorb available listings and maintain balanced market conditions.
Key Metrics – Durham Region (May 2026):
- Average Sale Price: $851,065 (↑ 0.83% from April)
- Days on Market: 24 (↑ from 23)
- Sales: 804 (↑ 13.56%)
- New Listings: 1,978 (↑ 2.86%)
- Average SP/LP Ratio: 99% (no change)
Area Breakdown
Oshawa
- Avg. Price: $708,723 (↓ 2.00%)
- Sales: 183 (↑ 9.58%)
- New Listings: 514 (↑ 11.26%)
Whitby
- Avg. Price: $949,657 (↑ 4.26%)
- Sales: 151 (↑ 9.42%)
- New Listings: 351 (↑ 8.67%)
Ajax
- Avg. Price: $838,788 (↓ 5.26%)
- Sales: 128 (↑ 31.96%)
- New Listings: 237 (↓ 4.05%)
Pickering
- Avg. Price: $927,422 (↑ 0.67%)
- Sales: 329 (↑ 140.15%)
- New Listings: 126 (↓ 63.79%)
Clarington
- Avg. Price: $830,064 (↑ 5.04%)
- Sales: 142 (↑ 13.60%)
- New Listings: 346 (↑ 2.67%)
What’s Driving the Market?
Tightening Inventory
New listings across the GTA continued trending lower year-over-year while sales increased, reducing overall inventory levels and increasing competition in many segments.
Stronger Buyer Activity
Sales have increased steadily since the start of the year as buyers take advantage of lower prices and borrowing costs.
Affordability Remains a Factor
Despite improving activity, average selling prices remain below last year's levels across much of the GTA, helping support demand.
Market Balance Shifting
While buyers continue to enjoy negotiating power, the gap between supply and demand is narrowing as inventory is absorbed more quickly.
Looking Ahead
For Buyers:
Market conditions remain favourable, but inventory trends suggest opportunities may become more competitive if demand continues strengthening through the summer and fall.
For Sellers:
Improving sales activity and tightening inventory are positive signs. Homes that are well-priced and well-presented continue to attract strong interest from active buyers.
Bottom Line:
May reinforced the ongoing recovery taking place across the GTA and Durham Region. Sales activity continues to improve, inventory levels are tightening, and affordability remains attractive relative to recent years. If current trends continue, market conditions could become increasingly balanced as we move through the remainder of 2026.
Stats provided by TRREB & Independent Reporting Company RE Stats Inc. Information is deemed reliable but not guaranteed and may vary by 2.5%.
Posted by Dan Plowman on
Leave A Comment