
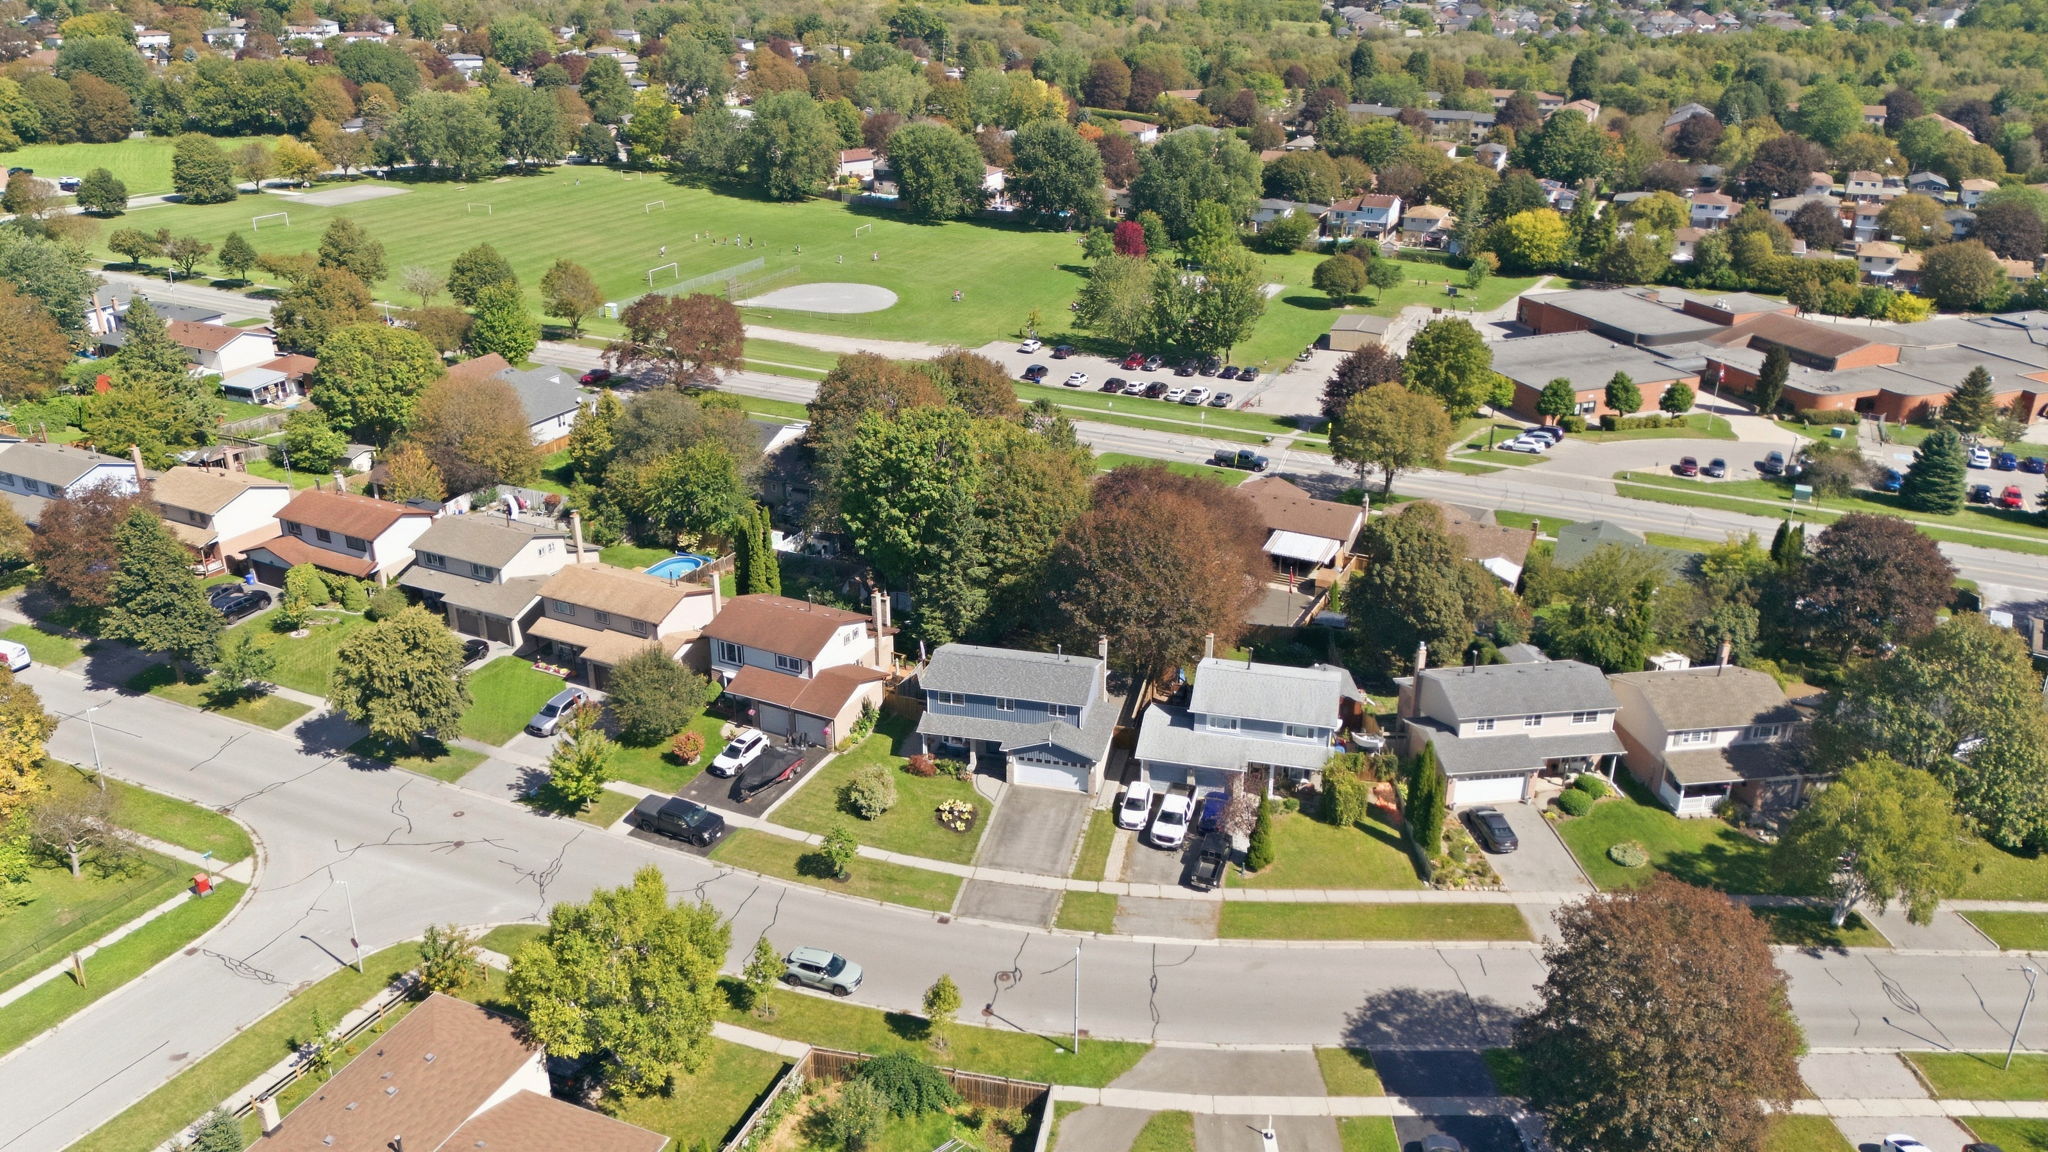
September is typically when the real estate market picks up again after the summer slowdown. But this year, the numbers tell a different story.
Across the Greater Toronto Area (GTA), home sales declined compared to last September as concerns about the economy, inflation and borrowing costs continued to influence buyer decisions.
In Durham Region, new listings increased significantly from August, but sales declined. That means buyers entered the fall market with more properties to choose from, while sellers faced increased competition.
The average Durham Region sale price did increase slightly, but the growing gap between new listings and sales is the more important trend to watch.
GTA Market Insights: Buyers Remain Cautious
According to the Toronto Regional Real Estate Board (TRREB), 5,040 homes sold across the GTA in September 2026, representing a 9% decline compared to September 2025.
New listings totalled 16,500, down 14.4% year-over-year.
On a seasonally adjusted basis, both sales and new listings declined compared to August, suggesting that uncertainty continued to affect market activity.
The GTA's average selling price was $1,006,409, down 5.1% year-over-year. The MLS® Home Price Index Composite benchmark also declined 4.7% compared to September 2025.
Both price measures edged lower month-over-month on a seasonally adjusted basis.
TRREB identified employment confidence, inflation and borrowing costs as important factors keeping potential buyers on the sidelines.
While many households may be interested in purchasing at today's lower prices, they are waiting for greater certainty before committing.
Durham Region Market Highlights: Listings Rise While Sales Fall
Durham Region experienced a noticeable increase in new listings during September, but that additional inventory was not matched by stronger sales.
The average sale price increased 1.05% to $828,141, compared to $819,569 in August.
Homes spent an average of 30 days on the market, down slightly from 31 days in August, while the average sale-to-list price ratio remained at 98%.
Key Metrics: Durham Region, September 2026
| Metric | September 2026 | Change from August |
|---|---|---|
| Average Sale Price | $828,141 | +1.05% |
| Days on Market | 30 | -3.23% |
| Sales | 552 | -8.31% |
| New Listings | 1,834 | +28.88% |
The most significant development was the difference between sales and new listings.
New listings increased nearly 29%, while sales declined more than 8%.
That created considerably more competition among sellers as the fall market began.
Although prices increased slightly, the rise in available inventory relative to transactions suggests that buyers continued to have meaningful negotiating opportunities.
Durham Region Area Breakdown
Oshawa
Oshawa's average sale price rebounded in September, increasing 4.15% to $679,861, compared to $652,775 in August.
-
Average Price: $679,861 (+4.15%)
-
Sales: 125 (-12.59%)
-
New Listings: 448 (+21.41%)
Despite the price increase, sales declined while new listings rose considerably.
That means buyers had more properties to consider, making accurate pricing especially important for sellers.
Whitby
Whitby experienced lower prices and a substantial decline in sales during September.
-
Average Price: $882,772 (-2.47%)
-
Sales: 96 (-25.58%)
-
New Listings: 318 (+16.06%)
Whitby recorded one of the largest monthly sales declines among the Durham municipalities tracked.
With more listings entering the market and fewer transactions taking place, sellers faced increased competition for available buyers.
Ajax
Ajax saw a decline in average selling prices, although sales improved slightly from August.
-
Average Price: $828,835 (-4.93%)
-
Sales: 77 (+6.94%)
-
New Listings: 229 (+33.14%)
Ajax recorded a particularly strong increase in new listings.
While buyer activity improved, the increase in available properties was substantially larger, providing buyers with additional choice.
Pickering
Pickering's average sale price declined in September as new listings increased and sales slowed.
-
Average Price: $893,842 (-4.45%)
-
Sales: 92 (-12.38%)
-
New Listings: 277 (+28.24%)
The combination of fewer sales and nearly 28% more new listings suggests a more competitive environment for sellers.
For buyers, the additional selection may provide opportunities to compare properties and negotiate.
Clarington
Clarington stood out in September with the strongest monthly price increase among the five Durham municipalities tracked.
-
Average Price: $781,521 (+6.48%)
-
Sales: 113 (+9.71%)
-
New Listings: 362 (+45.38%)
Both prices and sales increased, indicating stronger activity than in several neighbouring communities.
However, new listings rose substantially faster than sales, meaning competition among sellers also increased.
What's Driving the September Real Estate Market?
1. More Homes Are Competing for Fewer Buyers
The most important Durham Region statistic this month is the nearly 29% increase in new listings alongside an 8.31% decline in sales.
This does not mean every property is struggling to sell, but it does mean sellers need to pay closer attention to competing listings.
When buyers have more options, differences in price, condition, presentation and location become increasingly important.
2. Economic Uncertainty Continues to Influence Decisions
Across the GTA, buyers remain cautious about inflation, employment security and future borrowing costs.
Even households that are financially prepared to purchase may be delaying their decisions until they feel more confident about the economy.
This helps explain why improved affordability has not automatically translated into stronger sales activity.
3. Durham Home Prices Are Moving Differently by Community
Durham Region's average sale price increased 1.05% in September, but that regional figure doesn't tell the whole story.
Oshawa and Clarington recorded price increases of 4.15% and 6.48%, respectively.
Meanwhile, Whitby, Ajax and Pickering experienced declines.
Monthly average prices can also be influenced by the types and price ranges of properties sold, so these changes should not automatically be interpreted as equivalent changes in individual home values.
4. The Fall Market Is Giving Buyers More Choice
September brought 1,834 new listings to Durham Region, compared to 1,423 in August.
For buyers who have been waiting for more selection, that increase is meaningful.
For sellers, it reinforces the importance of understanding the competition before choosing a listing price.
Looking Ahead: What Does This Mean for Buyers and Sellers?
For Buyers
September's numbers suggest that buyers in Durham Region have more opportunities to compare properties and negotiate than they did during periods of tighter inventory.
With sales declining and new listings increasing, there may be opportunities to purchase without the same level of urgency experienced in stronger seller's markets.
However, desirable homes that are priced appropriately can still attract competition.
The key is understanding the specific neighbourhood, property type and price range rather than relying on regional averages.
For Sellers
The fall market has brought more competition.
With new listings rising nearly 29% and sales declining, sellers need to be realistic about how their property compares with other available homes.
Pricing above current market conditions can result in longer selling times, particularly when buyers have several comparable properties to choose from.
A strong presentation, effective marketing and a pricing strategy based on recent comparable sales are increasingly important.
Bottom Line: The Fall Market Has Started, but Buyers Are Still Cautious
September 2026 brought a modest increase in Durham Region's average sale price, but the broader market showed signs of continued buyer hesitation.
Sales declined, new listings increased and the average home continued to sell below its asking price.
The GTA experienced similar caution, with sales falling 9% year-over-year and average selling prices remaining below September 2025 levels.
As we move further into the fall, the most important question is whether buyer activity begins to strengthen or whether inventory continues to build.
For anyone planning to buy or sell in Oshawa, Whitby, Ajax, Pickering or Clarington, understanding the local market is more important than simply following the GTA headlines.
The Dan Plowman Team can help you understand current property values, competing listings and the market conditions affecting your next move.
Stats provided by TRREB and Independent Reporting Company RE Stats Inc. Information is deemed reliable but not guaranteed and may vary by 2.5%.
Posted by Dan Plowman on
Leave A Comment